
Capitulation Complete: A New Cycle Begins
Where we sit on the curve, what the marginal holder does next, and why this is the most uncomfortable part

The Sovereignty Brief · Issue #017 · June 16th 2026

Capitulation is not one event. It is two.
The first happens on the price axis. Holders sell because they have to, or because they cannot stomach the drawdown any longer. The chart finds a level where there is nothing left to sell. The exhaustion is mechanical, and it is loud.
The second happens on the time axis. It is quieter, and it is more dangerous. It is the moment a holder stops believing the asset is going to do anything in the time horizon that matters to them. Something else is ripping. The opportunity cost feels punishing. The position is not down meaningfully from here, but it is going nowhere, and the holder is tired.
That is where Bitcoin sits today. The price capitulation is largely done. The time capitulation is the test the rest of this cycle will resolve.
This briefing is not a buy call. It is not a prediction that this is the exact bottom. It is an analytical map of where we are in relation to the three completed cycles that preceded this one, what the data says about the trap the marginal holder is about to walk into, and the macro architecture that makes the next leg structural rather than narrative.
The Price Axis: What the Data Actually Says
The most repeated number in Bitcoin commentary is that bear markets bottom around seventy-five percent below the prior peak. Like most market folklore, it is approximately right and precisely wrong. The actual numbers are sharper than that, and the trend across cycles matters more than the headline mean.
Pulled directly from CoinGecko, here is the historic table.
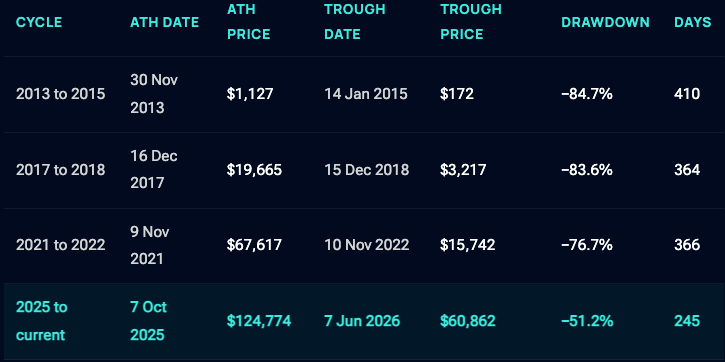
Three observations sit in that table that are worth pulling out individually.
One. The mean cycle drawdown across the three completed bears is eighty-one point seven percent. The 2021 to 2022 cycle came in at 77%, and the current cycle is at 51%. We have not yet matched the shallowest historic bear, let alone the deeper ones.
Two. The drawdowns are getting less severe with each cycle. 85%, then 84% then 77%. The trajectory is not random. It is the signature of an asset moving from speculative tail to institutional core, with a deeper bid forming at progressively higher levels.
Three. The duration is remarkably consistent. 364 days, 366 days, 410 days. Each prior bear ran roughly twelve months from all-time high to bottom. We are 245 days in to the current cycle. That puts us inside the back half of the historic time window, with three to five months left if the pattern holds.
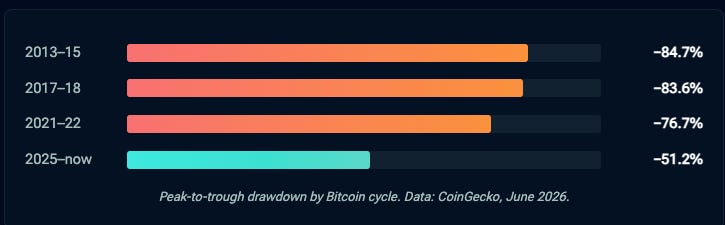
The honest reading is this. There can be further downside. A test of $46,000 would replicate the 2021 cycle drawdown depth from the current cycle’s all-time high. A test of $54,000 would tag the spot ETF accumulation zone from early 2024, where structural buyers built positions before the institutional narrative was priced in. Neither of those outcomes would be remarkable in cycle terms. Both would be exhaustion, not collapse.
What the data does not support is the idea that we are early in this bear. We are not. We are late.
The Time Axis: The Trap the Marginal Holder Is About to Walk Into
If the price axis was the only test, this would be a simpler conversation. Hold through the bottom, run the maths, wait for the next halving cycle to do its work. Most holders cannot do this. Not because they fail to understand the maths. Because they cannot sit still while something else is making generational returns.
The opportunity cost trade is the killer.
While Bitcoin has been chopping between $60,000 and $70,000, the AI complex has gone vertical. The iShares Semiconductor ETF is up roughly 89% year to date. NVIDIA is trading at $212 Palantir at $134. Microsoft at $398. The Nasdaq software ETF is participating. The narrative is irresistible. AI is real. The earnings are real. The capital is flowing.
The marginal Bitcoin holder watches this every day. Their bag is not down meaningfully from here. It is just not going up. The relative loss against the AI cohort feels larger each week. At some point, often within ten percent of the cycle bottom, that holder makes a decision they will regret for years. They sell Bitcoin to chase the trade that is already three quarters of the way through its move.
This is not a forecast. It is a pattern that has played out in every prior cycle in slightly different costumes.
In 2017, the rotation that ate the unfaithful was the early ICO complex. Holders sold Bitcoin to chase ICO mania, before watching the ICO bubble vaporise most of the names that promised them everything.
In 2019, it was the FAANG trade. The narrative was that the future belonged to the megacap software platforms and Bitcoin had failed to deliver on its store-of-value promise. The marginal holder sold the bottom and bought into the late innings of one of the most consensus trades of the decade.
In 2022, it was the rates trade. With Treasuries paying five percent and Bitcoin halving on the screen, the comfortable position was to rotate into duration. Then duration got crushed by the next leg of the inflation cycle, and Bitcoin began its move to a new all-time high.
The specific rotation changes every cycle. The structural error does not. The marginal holder sells the asset that has done nothing in the past twelve months to buy the asset that has done everything in the past twelve months. They sell exhaustion. They buy extreme. The reversion eats them on both sides.
In 2026, the rotation is AI. The setup is identical.
None of this is a comment on the merit of the AI complex as a long-horizon investment. It almost certainly is one. The point is that when an asset has tripled in twelve months, the asymmetry that was present at the start of the move is mostly gone. When an asset has halved in twelve months, the asymmetry is mostly there. Trading the second to buy the first is a structural mistake, and the cycle data says it is the mistake the largest population of marginal holders is about to make.
Be aware of this. That is the entire reason this section exists.
Realised Price: What the Network Is Telling Us
The cleanest single chart for assessing where we sit on the cycle, in my view, is the Realised Price chart maintained at charts.bitbo.io/realized-price. It is worth a careful look. Three layers, one signal.
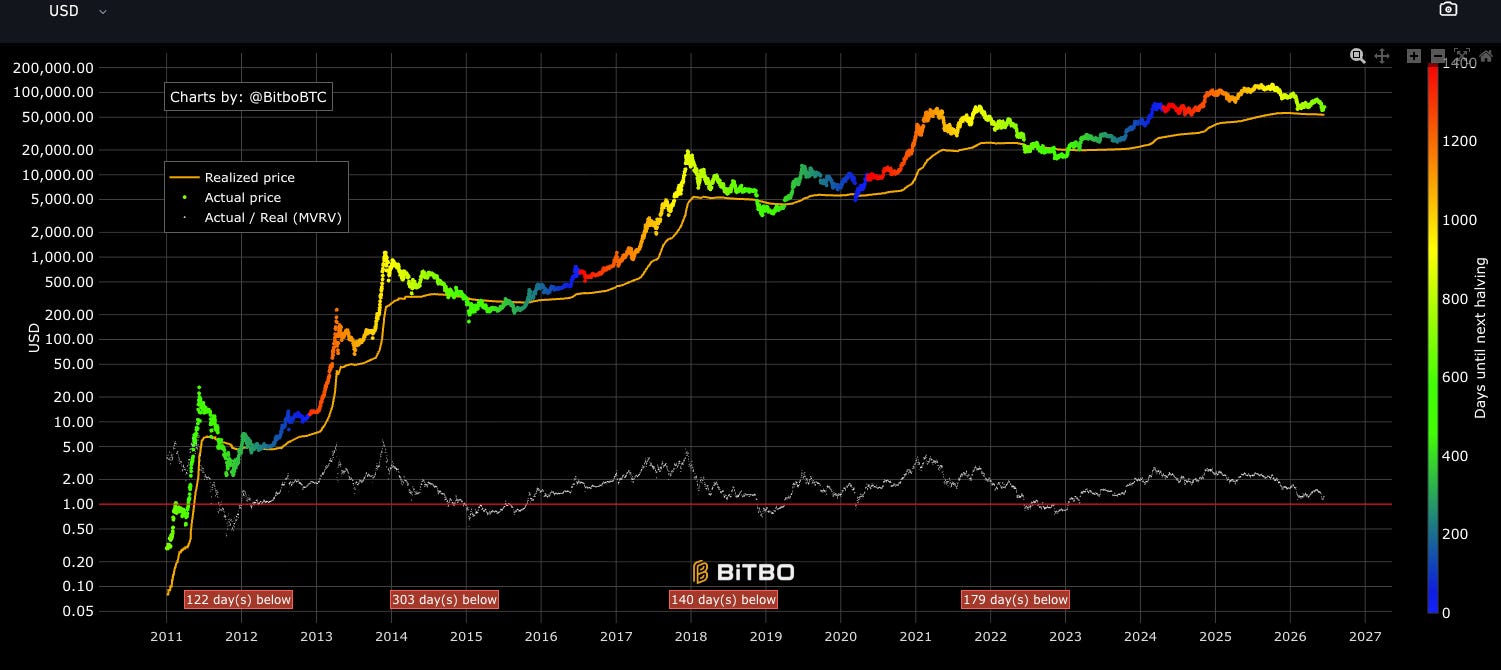
The rainbow plot shows Bitcoin’s spot price over time, colour coded by days remaining until the next halving. The cycle structure is visible without commentary. Each halving compresses the colour band, then the price expands away from it. The rhythm is consistent enough to be predictive without being precise.
The yellow line is the Realised Price. This is the average price at which every Bitcoin in existence last moved on the network, weighted by the value of those movements. It is, in plain English, the network’s cost basis. The price below which the average holder is genuinely underwater.
The grey oscillator at the bottom shows the ratio of the spot price to the Realised Price. When it is high, the spot price is rising faster than coins are being used and moved. That is unsustainable, and historically marks late-cycle euphoria. When it compresses toward the red line at one, spot is converging with the cost basis of the network, and historic floors form.
Why this matters more than any single price level is straightforward. The Realised Price has acted as durable support at every prior cycle bottom. When the spot price tags the yellow line, long-term holders who bought at the lows have not yet moved their coins. The supply available for sale is dominated by short-term holders whose cost basis sits higher than the spot. The marginal seller exhausts. The marginal buyer arrives.
That is not a guarantee of a precise bottom. It is the cleanest on-chain signature we have for one. Watch the line. The closer spot gets to it, the closer we are to the floor that has held in every prior cycle.
The Cycle Repeat: What the Past Says About the Path Ahead
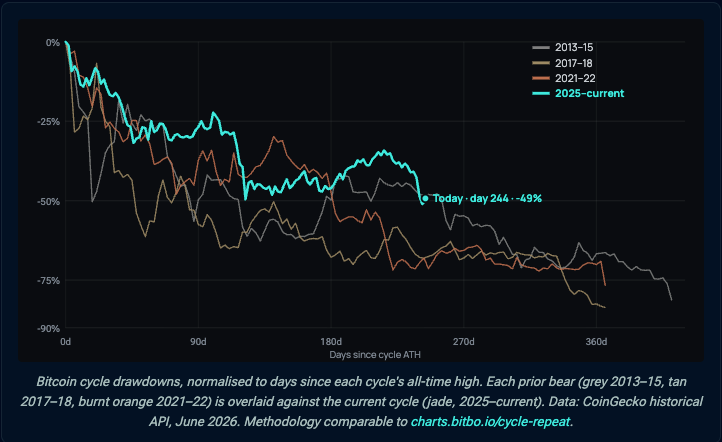
The cycle-repeat overlay at charts.bitbo.io/cycle-repeat takes the price action of each prior cycle, normalises it to its own halving, and projects it forward. The result is a fan of historic precedents through which the current cycle is travelling. The current cycle’s projected top, on the analyst-provided fit, sits in the region of $400,000 in 2029.
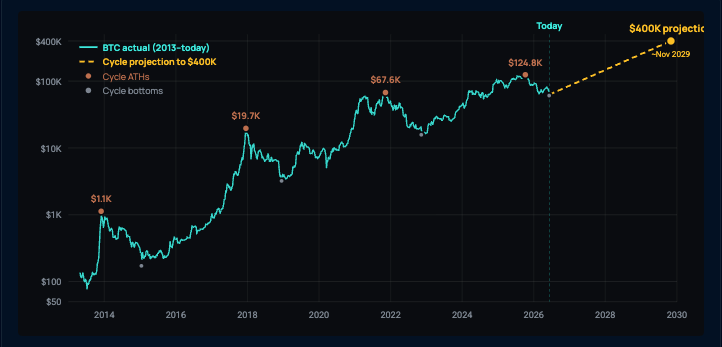
Bitcoin price 2013 to today, log scale. Real CoinGecko data through June 2026. Each prior cycle ATH is marked. Cycle bottoms shown in grey. The dashed yellow line is a cycle-consistent projection from the current zone to a $400K target around November 2029. The projection is what the historic cycle-multiplier pattern produces, not a price target. Methodology comparable to charts.bitbo.io/cycle-repeat.
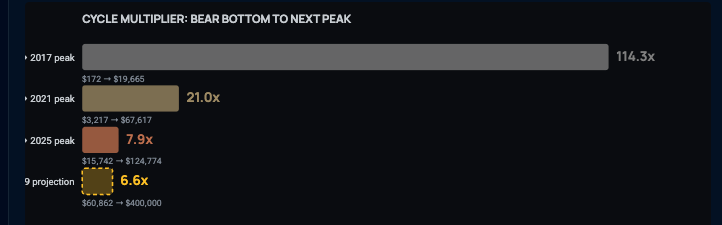
Dampening multiplier pattern. Each successive cycle delivers a smaller multiple from bear bottom to next peak. The 6.6x projection sits inside the trend.
Bear-bottom-to-next-peak multiplier across the three completed Bitcoin cycles, with the current cycle's projection sitting inside the dampening trend. Each successive cycle delivers a smaller multiple as the market matures and institutional capital deepens the floor at progressively higher levels. The 6.6x projection is the central case the historic pattern produces from the current bottom zone. Data: CoinGecko historical API.
That number is a projection, not a promise. It is built on the assumption that each successive cycle delivers a diminishing return relative to the prior, the same dampening signature visible in the drawdown table above. By that maths, a $126,000 cycle high projects to a multiple in the three to four times range at the next peak. $400,000 is the central estimate of that range. It is neither aggressive nor conservative. It is what the historic pattern, run forward, currently produces.
Past performance is not indicative of future results. The structural environment of each cycle is different. The point is not the precision of the $400,000 figure. The point is that we are inside a trajectory that has produced consistent multiples through three completed cycles, and the early-2026 data is sitting where it should be sitting if the trajectory is intact.
The honest read on cycle four is this. We are roughly two-thirds of the way through the historic drawdown depth, three-quarters of the way through the historic drawdown duration, and the floor signature on Realised Price terms is forming where it should form. The work that needs to happen between here and the next leg is the work of waiting, not the work of buying lower.
What This Means For You
This briefing is not an invitation to add to underwater positions. It is not an invitation to deploy fresh capital you do not have to spare into an asset still capable of further downside. It is not a forecast.
It is an analytical framework, and the framework points to one conclusion that the data, the cycle history, and the macro setup all agree on. The risk in this part of the cycle is not being long Bitcoin. The risk is being the marginal holder who pukes here to chase a move that is already three quarters complete.
The bear market does not punish people for being long the wrong asset. It punishes them for switching to the wrong asset at the wrong time. Every cycle, the marginal holder makes the same trade in a different costume. Every cycle, the trade is wrong. The data on the table above is the receipt.
If you hold Bitcoin and you are considering rotating into the AI complex at these levels, sit with the cycle data first. Look at the Realised Price chart. Then decide.
If you do not hold Bitcoin and you have spent the last twelve months telling yourself you missed it, recognise that the cycle structure says you are inside the second half of the most uncomfortable buying window in the asset class. The marginal buyer in the back half of a Bitcoin bear is the one who ends up positioned for the next cycle, while the consensus chases something else.
And if you do hold Bitcoin, the next question is structural, not directional. How is the position held. Who can move it. What happens to it if something happens to you. Those questions are the ones I unpacked in Issue #016 of this brief, and the answers are not optional just because the price is interesting. Multi-signature collaborative custody is the structure that lets you survive the next cycle without becoming part of someone else’s story.
Action Steps
Pull up the cycle data yourself. Do not take my word for the table. Replicate it on CoinGecko, on Coinglass, or on bitbo.io. Build the conviction from the source, not the commentary.
Look at the Realised Price chart. Watch where the spot price sits relative to the yellow line. The closer they get, the closer the network is to its historical floor.
Do not sell the Bitcoin to buy the AI. The asymmetry runs the other way at these levels. The AI complex is pricing extreme. Bitcoin is pricing exhaustion. The reversion is the move that lives in the second half of this cycle, not the first.
Position the custody before you position the size. If your Bitcoin is sitting on an exchange, in a single-key cold wallet with no succession plan, or in a structure you have not properly stress-tested, the size of the position is the second-order question. The structure is the first.
Have the conversation before you need it. The worst time to design a position for the next cycle is the moment you wish you had already done it.
On the call we discuss cycle positioning, multi-signature collaborative custody, and the structural pieces that turn a Bitcoin position into a long-horizon asset rather than a trade. No pressure. No pitch. A conversation about doing this properly.
Bisher Khudeira is Executive Director of Stormrake, an AUSTRAC-registered digital asset brokerage based in Melbourne, Australia. He has spent fourteen years in derivative, FX and digital asset markets. This briefing is general information and is not financial advice. It does not take into account your personal objectives, financial situation or needs. Past performance is not indicative of future results. Seek independent advice before acting.
Sources: CoinGecko historical price API (cycle data, drawdown table). Coinglass and bitbo.io (charts.bitbo.io/realized-price, charts.bitbo.io/cycle-repeat) for realised price and cycle-repeat overlay. Arthur Hayes, The Butterfly Touch, Maelstrom newsletter, June 2026. Equity market data via Yahoo Finance and stockanalysis.com, June 2026.
⭐ remarkably educational and informative first-class analysis...
accumulate, do not sell bitcoin!
⭐ remarkably educational & informative first class analysis...